1.1 Ad hoc Reports
Custom Ad Hoc Reporting allows you to create reports in the system by pulling data from fields within the application. There are no limits on the number of reports that you can create.
1.1.1 Accessing The Ad Hoc Reports Section:
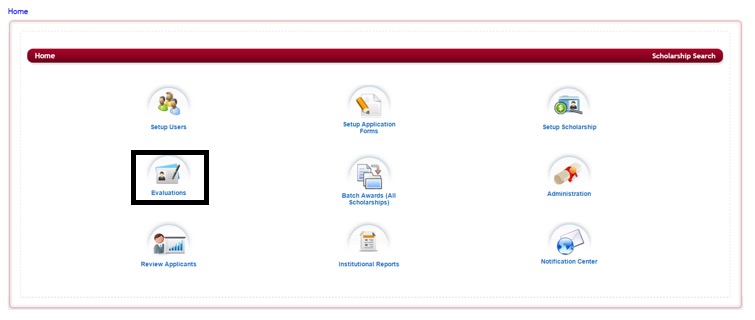
Step 1: From the Home page select Evaluations

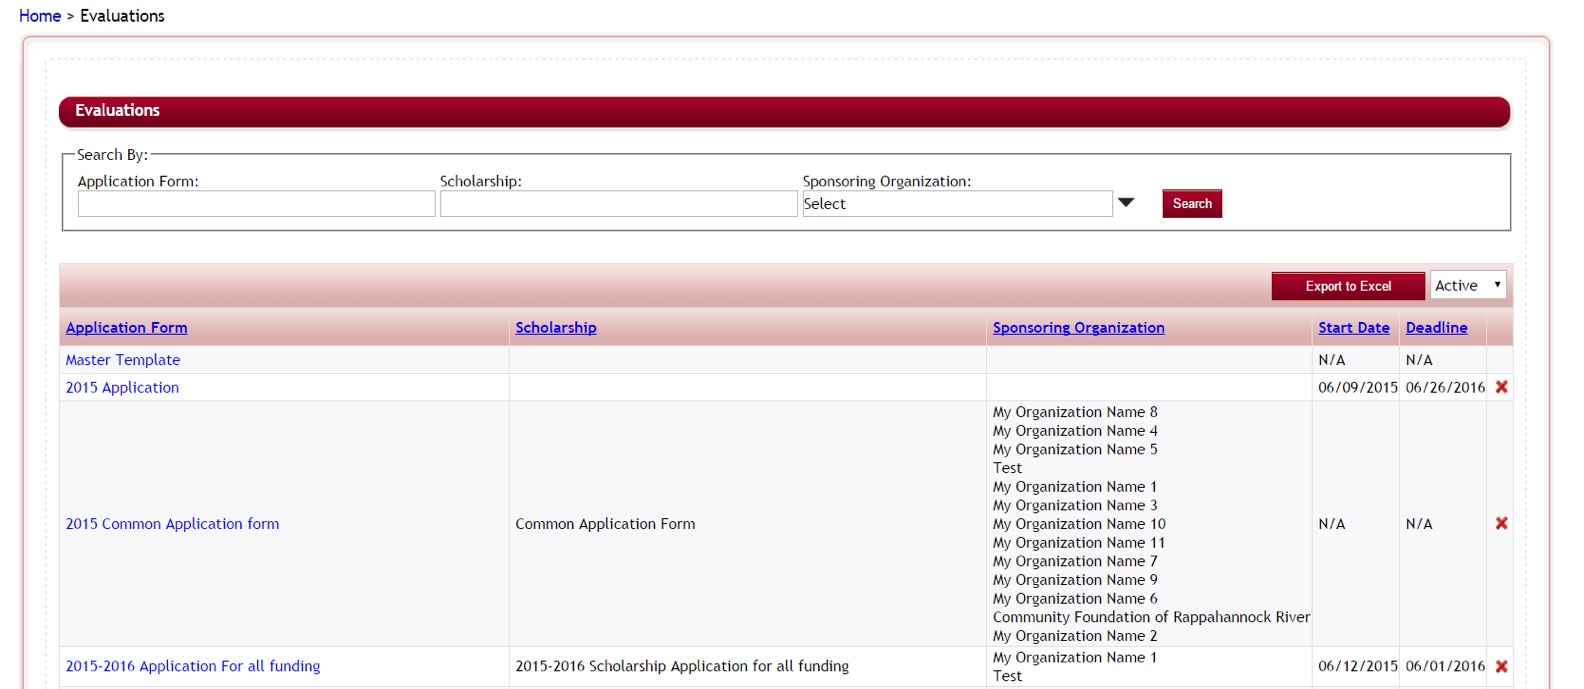
Step 2: This will direct you to the Evaluations screen. Custom Reports are created for each individual application, therefore, you will need to click on the appropriate application that you want to create the custom report for.

Step 3: Once you select the application you will be directed to the Evaluation Dashboard, select the Reports icon.
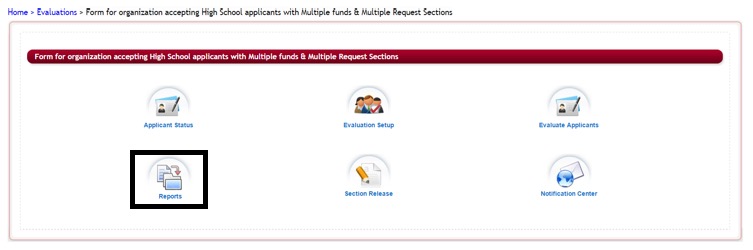
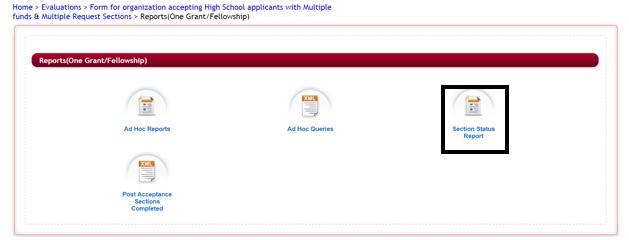
Step 4: This will direct you to the Reports dashboard. Select the Ad Hoc Reports:
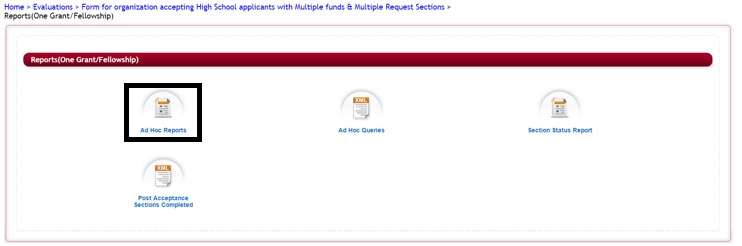
Step 5: Once you select Ad Hoc Reports the following screen is displayed: (Note: if you do not have any reports created the listing will be blank)
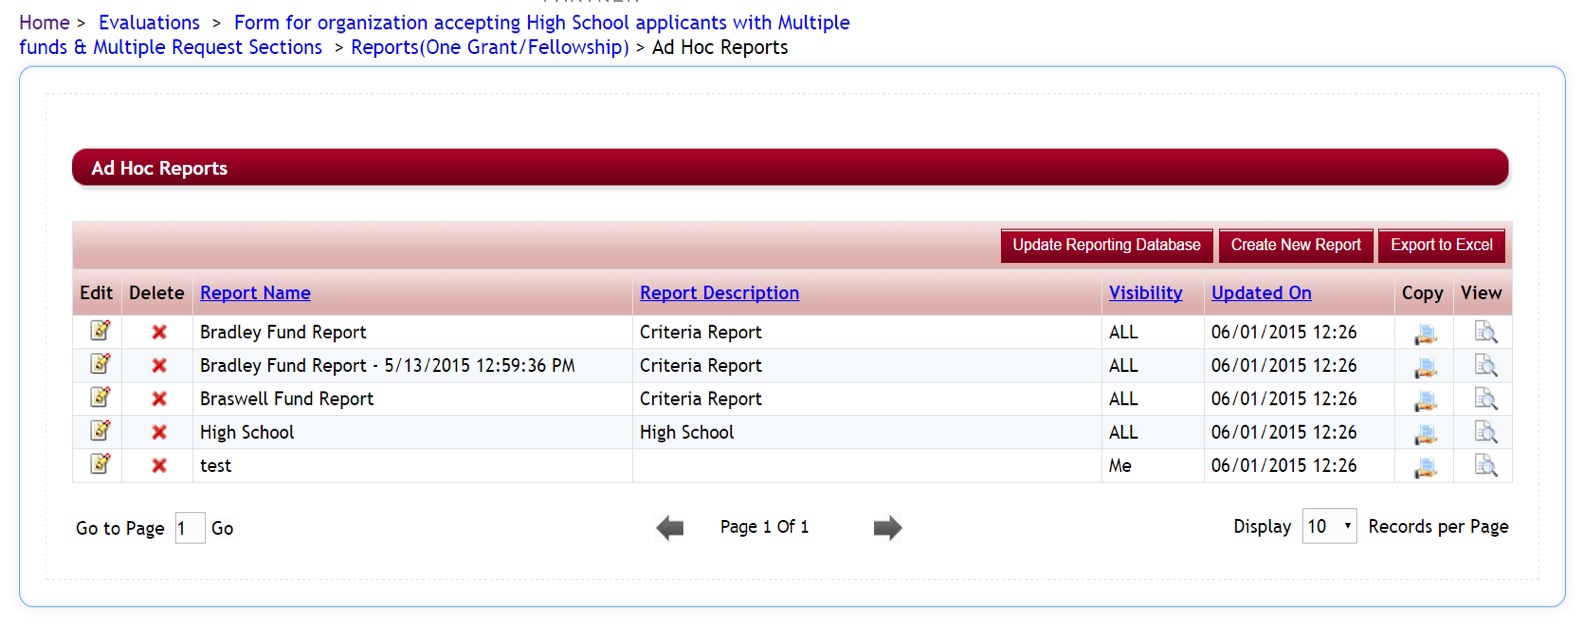
Ad Hoc Reports Listing Overview:
![]() - Allows you to export a listing of all the custom reports that are in the Report List to an Excel spreadsheet.
- Allows you to export a listing of all the custom reports that are in the Report List to an Excel spreadsheet.
- Report Name - Name the report has been given when created. Clicking on this column header will sort the Report Name listing alphabetically.
- Report Description - Brief description of the report’s purpose. Clicking on this column header will sort the Report Description listing alphabetically.
- Visibility – ALL or ME – This will let you know who can see the report. Whether it is Visible to Me, for reports that only you want to be able to view or Visible to All, to allow all the Admin to be able to view.
- Updated On – Shows the date and time, the report was last updated with current data. This date will change when the report has been edited and when the Update Reporting Database button has been pushed.
1.1.2 Creating a Custom Ad Hoc Report
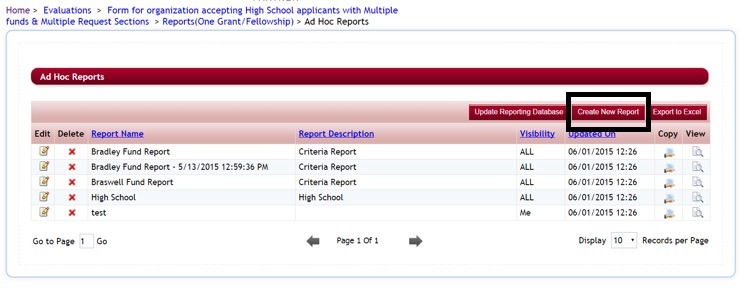
Step 1: From Ad Hoc Reports listing, click on the Create New Report button.
![]()
Step 2: The following screen is displayed:
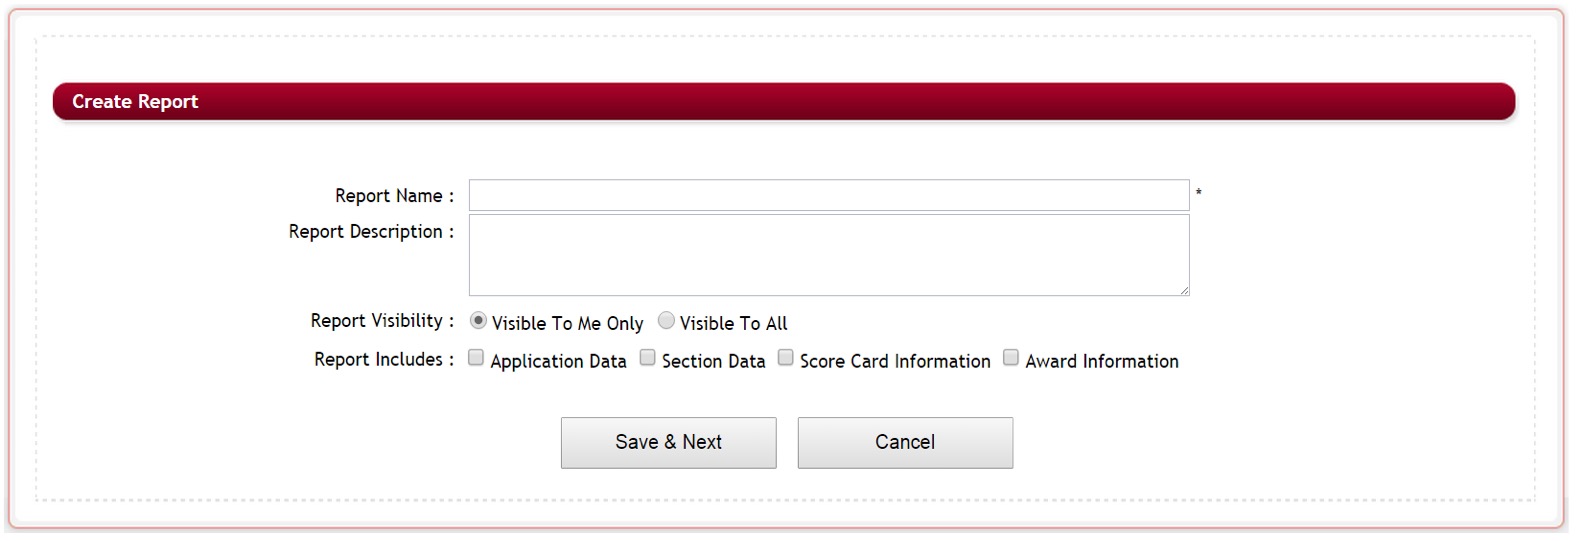
Step 3: Name the Report
- Report Name – Enter the name you want to give to the report.
- Report Description – Enter the report description, describing the purpose of the report.
Step 4: Report Visibility – set access for who can view the report
- Visible to Me – only the person that created the report can view it.
- Visible to All – allows anyone with a role type that can view reports to be able to view.
Step 5: Report Includes – Select the Data Areas that contain the various fields within your application that you need to pull into the report. Select each item by putting a check mark in each area you want to include. You can select one or all of the selections.
It is best practice to include the Application Data in every report so that you can pull on the status of your applicants.
| Application Data | Application Data will allow you to include the following in a report:
|
| Section Data | Section Data will allow you to select the sections in your application and the questions in that section. Place a check in the appropriate sections you wish to pull data on. |
| Score Card Information | Score Card Information allows you to pull all values from the question fields with- in the Evaluation Tasks that you set up as a part of your review process. You can also select the specific task and get the scores based on that one specific task. |
| Award Information | Award Data will allow you to include the following in a report:
|
Step 6: Click Save and Next to proceed to the next section, clicking Cancel will cancel the report and return you to the report listing.
Step 7: The following screen will appear will you will Select the Items to be included in your report. In the Select an Item select the section(s) in each Data Area that you want to include.
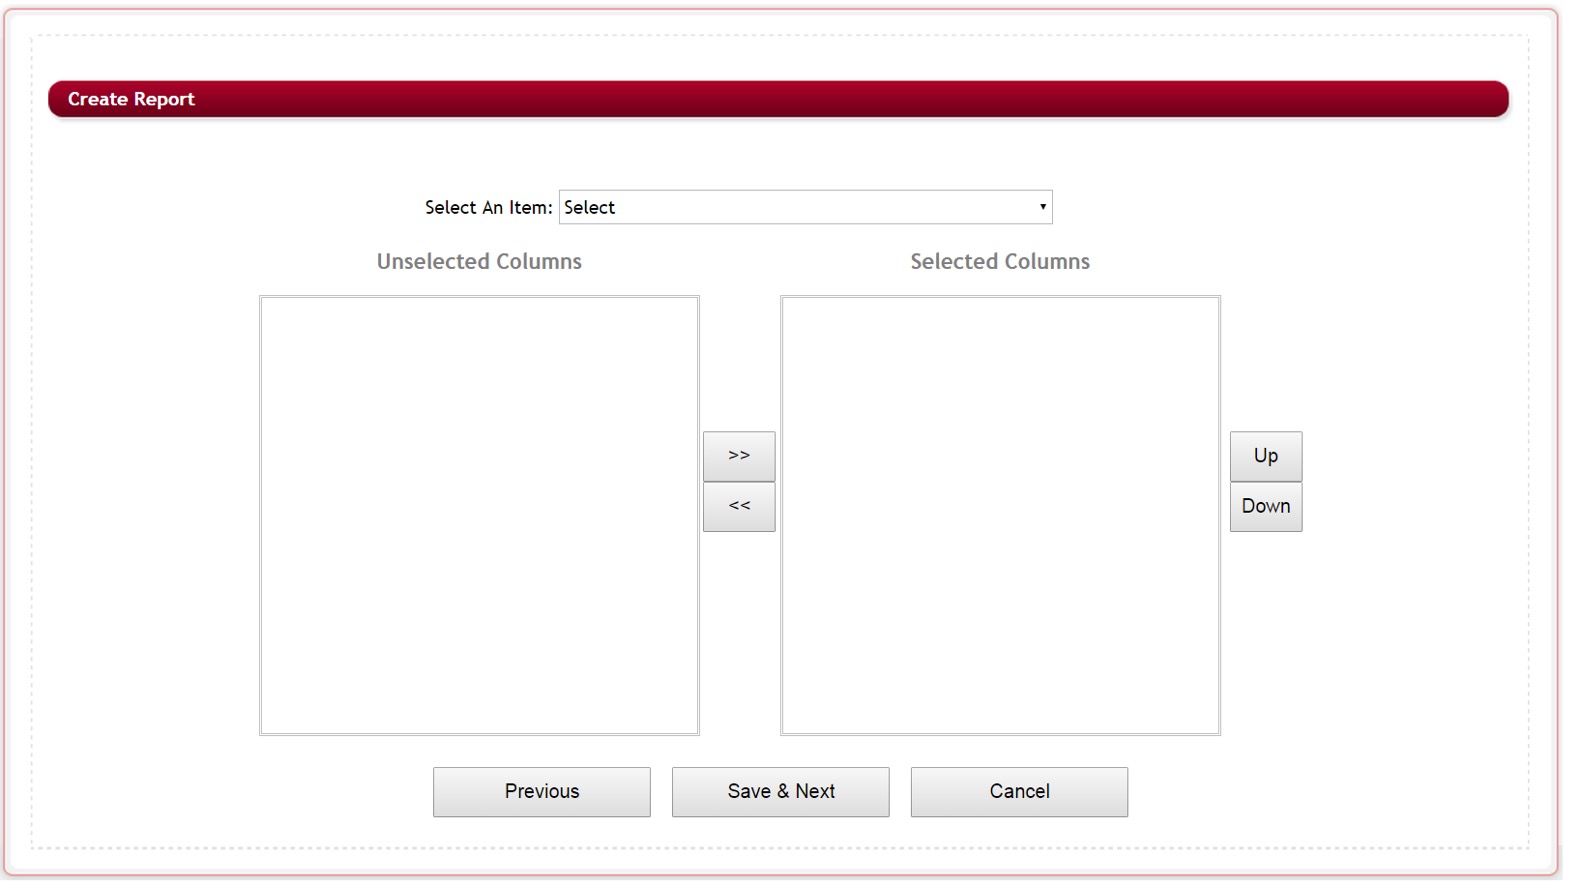
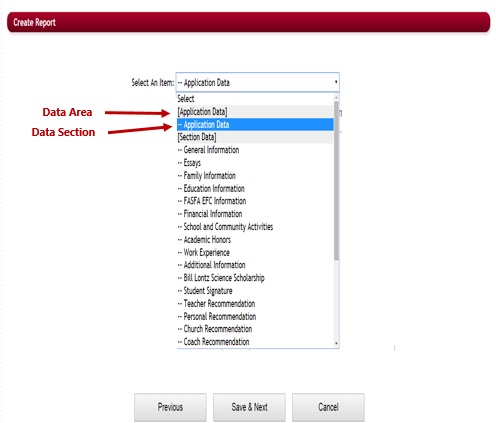
Step 8: Select An Item – Click on the dropdown menu. The following Data Area list will appear based on what data elements you previously asked to be included in the Step 5 above.
You will select the Section within that Data Area that contains the field, not the actual field yet. The data area will appear in the listing with brackets “[ ]” and then each individual sections within that data area will be listed below it. You can only select one section at a time.
Step 9: Once you select a section in the Select An Item, the Unselected Column will populate with all the available fields in that section.
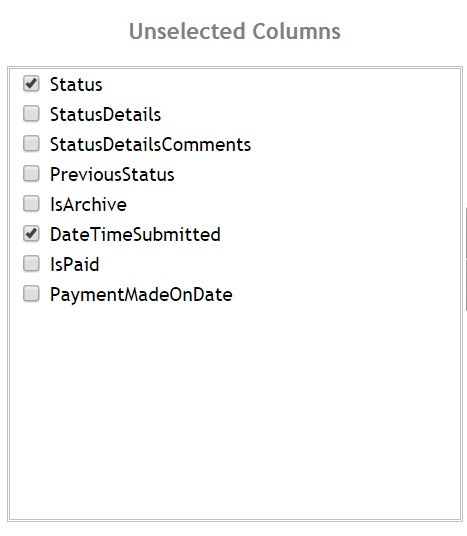
Step 10: Select each Individual Field Item/Question that you want as a column in your report by putting a check in the box to the left of the field you want to include in your report. You can select one or all in that section.
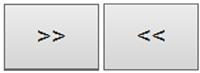
Step 11: Select the arrow pointing to the right to move that that selection over to the next column. To move a selection back place a check in the box and click on the arrow pointing to the left.
Step 12: Repeat steps 8 to 11 for each section you want to include items for in your report. Continue to select items from the drop down until you have selected all of the data field columns for your report.
Your screen will look similar to this:
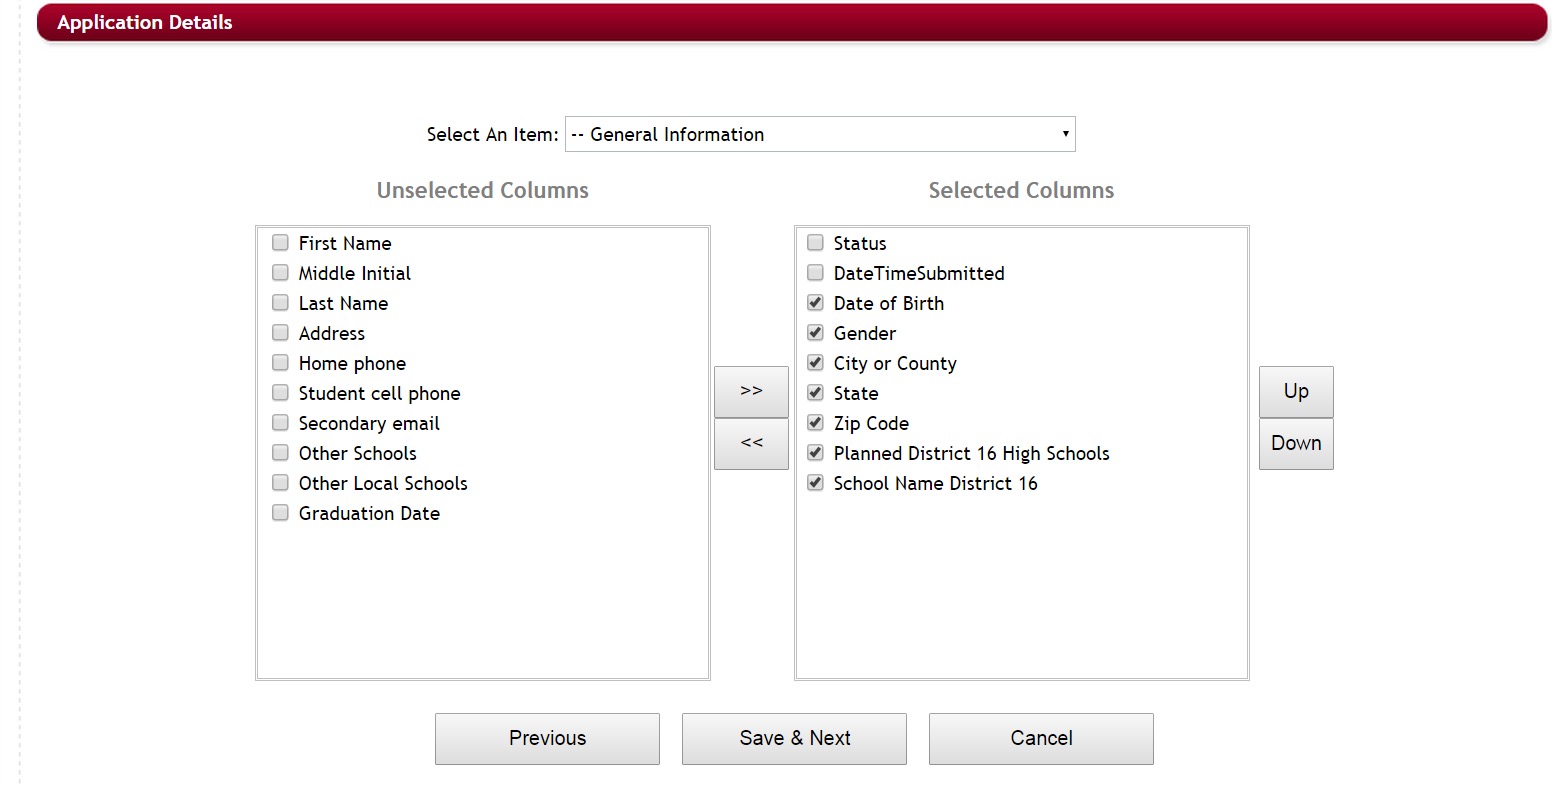
NOTE: You will always want to include the Application Data – Status as a column in your report. When running a report all status levels are included and will need to be filtered out in the next step to Add Conditions, or once you run your report it can be exported to excel and filtered in excel.
Step 13:If you need to move an items order, select the box next to the item you want to move, and click the up/down button until it is moved to the desired location. You can only move one item at a time, therefore, only that selection can be checked to move it.
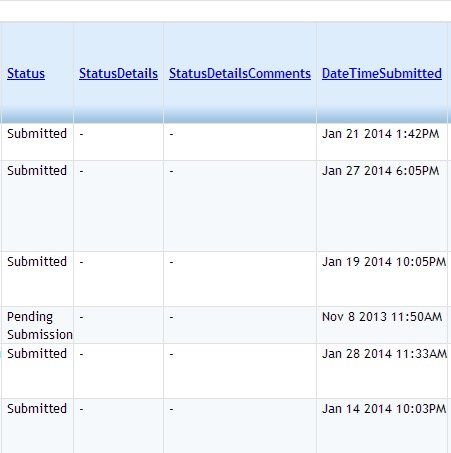
NOTE: Each item you pull to the right is the actual column that will be displayed in your report. Each row of your report will be each individual application showing how those question/item fields were answered within the application process. See below example of a generated report showing how each select field is a column.
Step 14: Once you have selected all your columns you can click on the Save and Next button to go to the next page and set the filters for your report.
- Previous will bring you back to the previous screen
- Cancel will cancel this report and return you to the list of reports
Step 15: The next screen is where you will enter the filters for your report.
After you add fields to your report you can add filters to the report.
Filters allow you to filter a group of applicants to only include those applicants in your report that meet a certain condition based on how they answered a specific question, or based on their status within the application process.
For example: If an Admin wishes to see a report of only female applicants, you can apply a condition filterto only show applicants that answered Female to the Gender Question.

Step 16: To add a New Condition Filter to a report select the Add New Condition button.
![]()
Step 17: The following screen will appear. You will create a line for each filter.
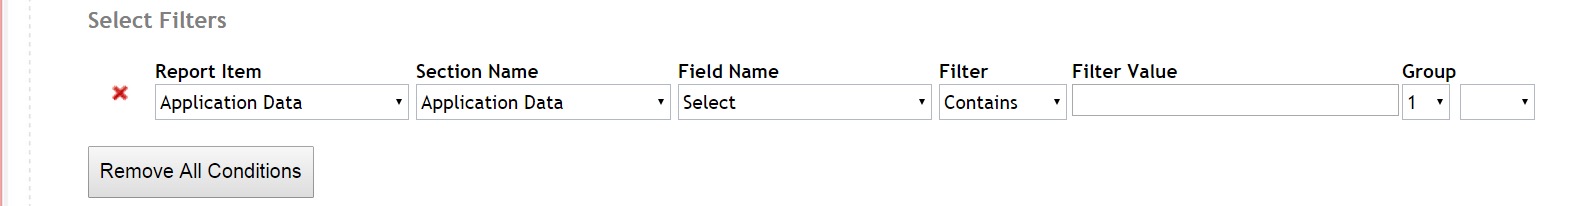
Step 18: Report Item: Select the Report Data Item that contains the Section Name you want to pull.
Step 19: Section Name: Select the Section Name that contains the Field Name.
Step 20: Field Name: Select the Field Name that contains the data you want to set a filter value on.
Step 21: Filter: This is the condition of the field value you want to select. Select one of the following types:
- Contains: Include if the value field contains this value/answer within the value
- Equals: Include if the value equals this value/answer. (or is exactly this value)
- Not Equal To: Include if the value does not equal this value/answer.
- Is Empty: Include if the value field does not contain any information, the field is blank
- Is Not Empty: Include if the value field contains any information.
- Starts With: Include if the value/answer starts with this value.
- In: Include if the value/answer is in this listing of values.
- Min/Max Value: For numeric values only, enter the minimum to maximum range the value/answer should fall within, in order to include.
- Greater Than: For numeric values only, enter the value in which all value/answers greater than shall be included.
- Less Than: For numeric values only, enter the value in which all value/answers less than shall be selected.
- Filter Value: Enter the exact Value/Answer you want the condition to be set on.
Step 22: Group: When entering multiple lines of filters you will need to group those filters into specific groups to pull date effectively.

Step 23: And/Or: Each time you add a condition and choose and/or in the last field a new search filter row will open up below for you to add your next filter.

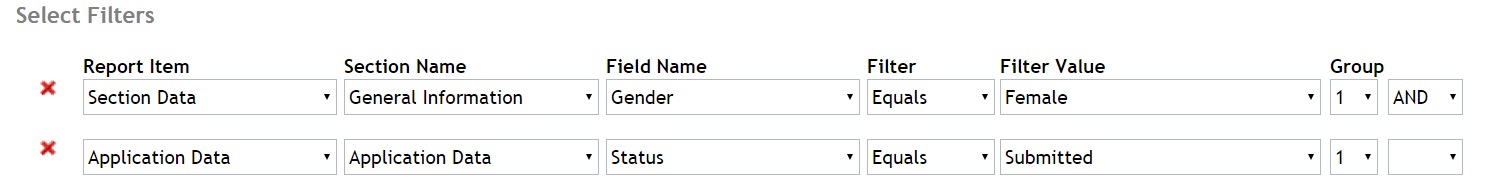
When entering multiple lines of conditon filters you will need to explain how each line of filters is to be related to the pulling of data. To add additional lines of filter conditions, you will need to simply choose either the “And” or the “Or” depending on how the current line relates to the next line of conditional filtering. On your last line of filters leave this blank, failing to do so will create an additional line of empty conditions and cause the report to not pull data. If you accidentally add this additional line, you must delete it by clicking the red “X” next to that line, prior to clicking finish and running your report.
Example 1: Filter Female applicants AND Filter Submitted Status – it will only pull applicants that answer Female for Gender and have a Status of Submitted. Both those condition filters must be met for the applicant to pull into the report.
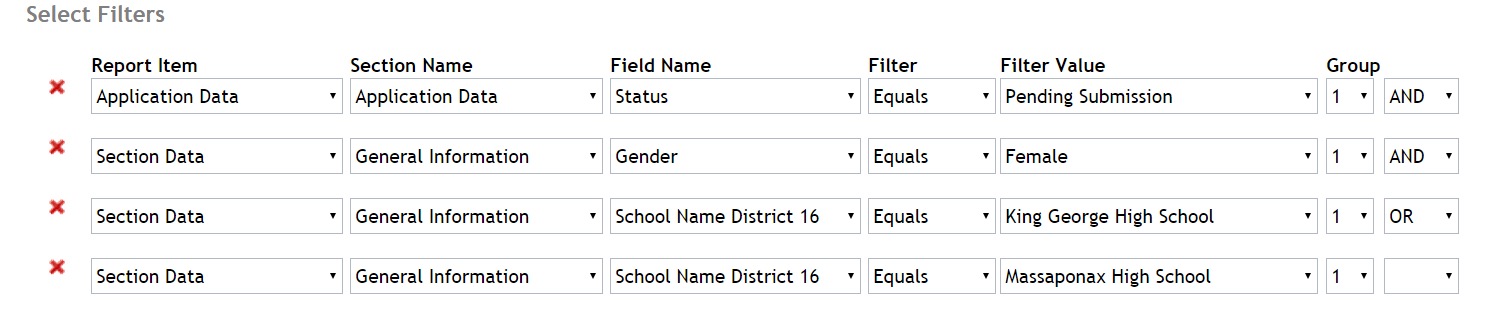
Example 2: If you use “OR” then the condition filter will pull on either or and therefore will give you all applicants that have submitted despite being female or not. In reports “or is mostly used within the same group if pulling on the same question and multiple choices for that question are being filter.
You want all female applicants that are pending submission that attended King George High School or Massaponax High School:
Step 24: Once you have finished entering all your filters for your report, select the Finish Button.

Finish will generate your report and bring you back to the report
Previous: Takes you back to the previous step to add columns to your report.
Cancel: Cancels the report and returns you to the report listing.
Note:
Use with Caution, this will delete all the conditions you just set. Clicking on the red “X” next to a condition will delete only that condition from the listing.
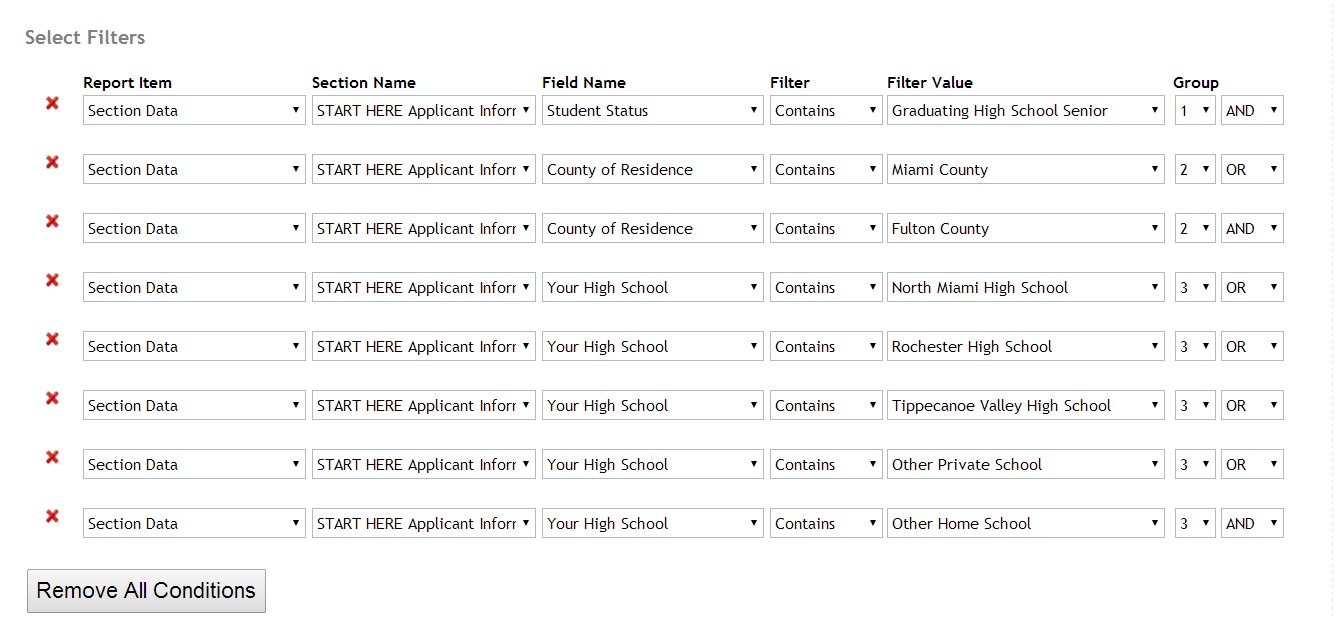
1.1. 3 Additional Examples of Setting up Grouped Conditions in Ad Hoc reports
Criteria for this funding source equals:
- Must be a Graduating High School Senior
- Residing in either Fulton County or Miami County
- Attending North Miami High School, Rochester High School, Tippecanoe Valley High School, Private School or Home School
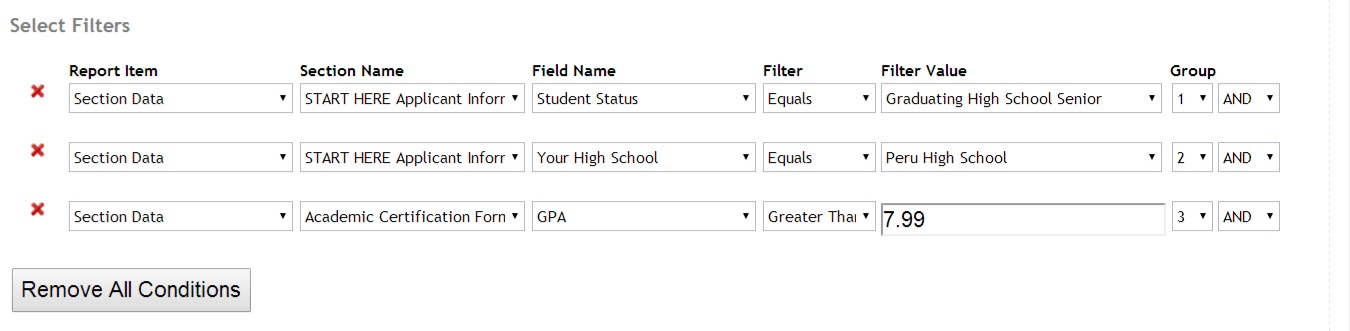
Criteria for this funding source equals:
- Must be a Graduating High School Senior
- Attending Peru High School
- GPA 8.00 or higher
1.1.4 Viewing Existing Ad Hoc Reports
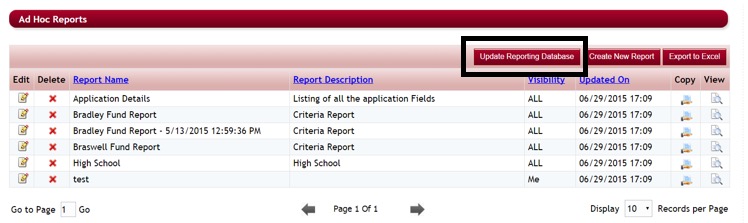
After you have created your report and have returned to the Ad Hoc report listing you will need to update your report with the most current data. Once the data has updated you can view the report.
Step 1: While in the Ad Hoc report listing, click on the Update Reporting Database button. Failure to click this will only retrieve data that has been entered since the last Update On date and will result in missing data.
![]()
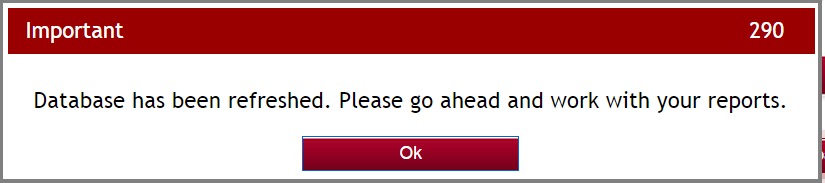
Step 2: When you will receive the message that the database has been refreshed, click OK.
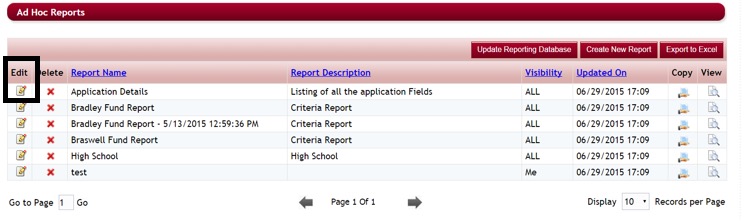
Step 3: In the Ad Hoc Report listing click on the View icon located to the far right of the row for the report you want to view.


Step 4: The following report screen will appear showing the matching data:
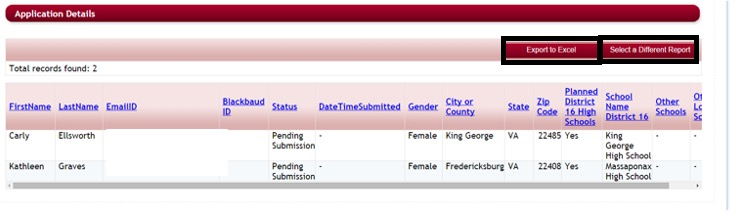
Step 5: You can use the scroll bar at the bottom and sides to move across the page and up and down to view additional applicants and columns. However, it is easier to export the report to Excel and view it in Excel. From there you can filter or edit the report in any manner that is needed. To export click the Export to Excel button located at the top of the report.
![]()
Step 6: This will then open the report as an Excel document on your local computer. Be sure to save the document so that you do not lose any additional formatting that you have done to it after you have exported it.
Step 7: When you are done viewing the report click the Select a Different Report to return to the Ad Hoc Report listing.

1.1.5 Editing an Existing Ad Hoc Report
You can add columns, remove columns, add additional condition filters, or remove conditions filters on existing reports.
Step 1: While in the Ad Hoc report listing click on the edit icon located to the left of the report you want to edit.
![]()
Step 2: Click the Save and Next Button under each section to move to the next section to make any appropriate changes to your report.
Note: Any changes you make are permanent and once you make a change and click to the Save and Next button that sections change is permanent and cannot be undone.
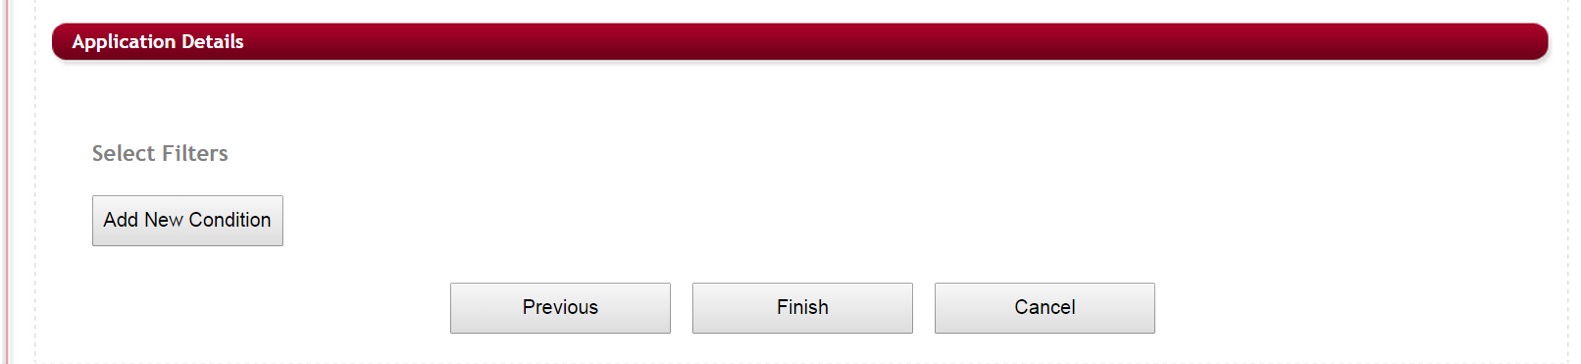
1.1.5.1 Editing The Condition Filters Section
When editing an existing report and you come to the Application Details page to add filters you will notice that the Add a Condition will not be present.
If you want to keep the existing conditions filters but add a new line of conditions you will need to enter the “and/or” field in the last line of conditional filters to reflect the status of how it relates to the next condition you are adding. Repeat this for each new condition, making sure to leave the last line of conditions as blank for this field.
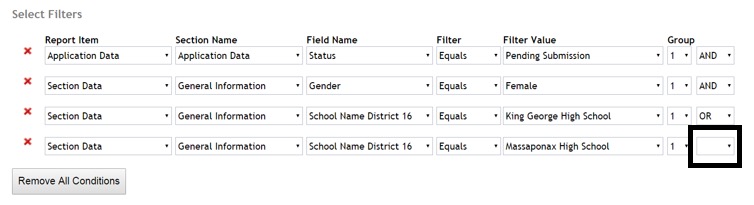
![]() If copying and existing report and you want to create a totally different set of condition filters for this report, click the Remove all Conditions to clear all the current conditions.
If copying and existing report and you want to create a totally different set of condition filters for this report, click the Remove all Conditions to clear all the current conditions.
FINISH – Be sure to click Finish to save the changes you made to the Condition Section.
1.1.6 Deleting an Exiting Ad Hoc Report
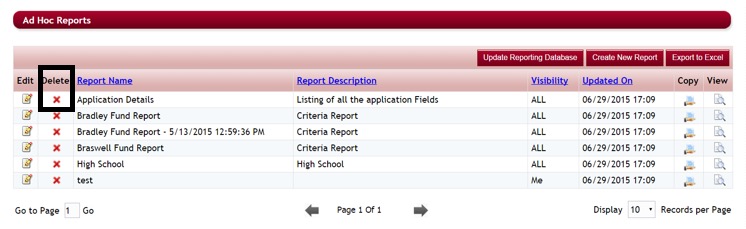
While in the Ad Hoc Report listing click on the red “x” next to the report you want to delete. Once a report is deleted it cannot be retrieved.
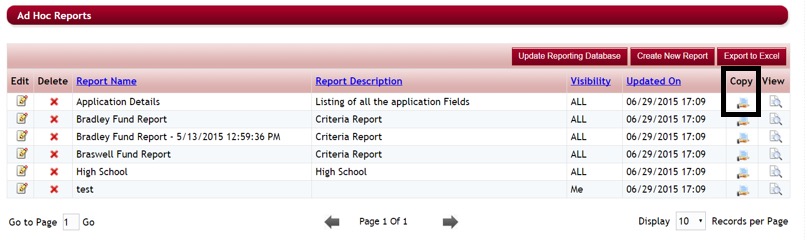
1.1.7 Copying an Existing Ad Hoc Report
If you would like to create a new report that is similar to an existing report in the Ad Hoc report listing, you can copy the report and edit it to make the adjustments for the new report.
Step 1: While in the Ad hoc report listing click on the Copy Icon that is located to the far right of the report you want to copy.

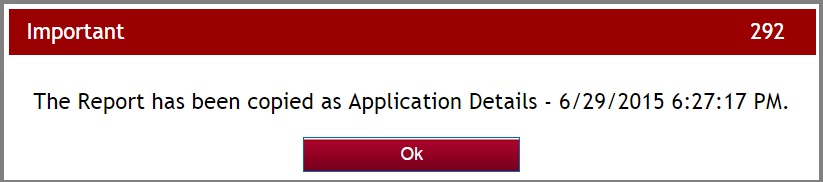
Step 2: You will receive a message that the report has been copied showing the new name that has been given to it. This will be the same name as the copied report but will also include the date you copied it. Click Ok to return to the report listing.
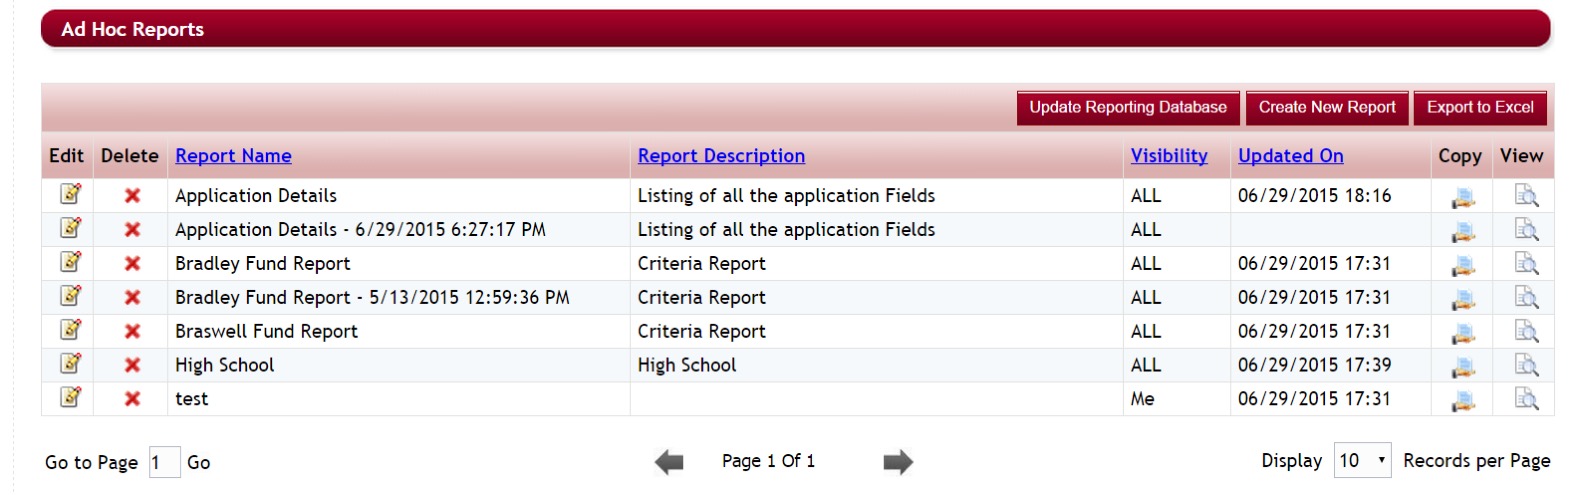
Step3: The report will appear in the report listing and then you can click the edit button next to that report to edit that report and change that name, selection data, and conditions to meet the needs of your new report.
1.2 Ad Hoc Queries
You can directly query the database by writing SQL queries. You will need to refrain from using words like Update, Delete, and Alter while writing a Query, as it will result in Syntax error. If you need assistance with queries, please contact CommunityForce. If you have purchased customized query reports they will be added here.
1.2.1 Accessing the Ad Hoc Queries
Step 1: From the Home page select Evaluations
Step 2: This will direct you to the Evaluations screen. Custom Reports are created for each individual application, therefore, you will need to click on the appropriate application that you want to create the custom report for.

Step 3: Once you select the application you will be directed to the Evaluation Dashboard, select the Reports icon.


Step 4: This will direct you to the Reports dashboard. Select the Ad Hoc Queries
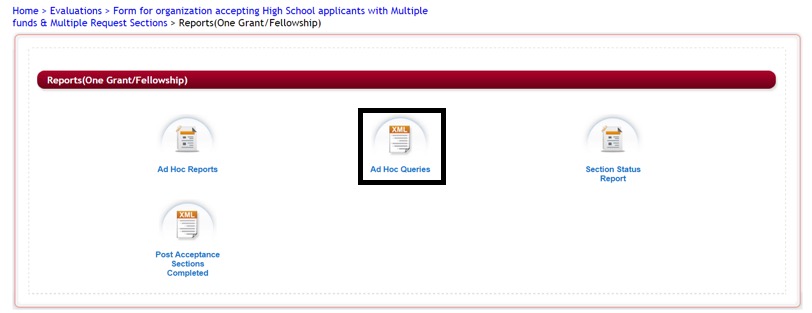
Step 5: Once you select Ad Hoc Queries the following screen is displayed:
1.2.2 Viewing Existing Queries
Step 1: While in the Ad Hoc Queries, click on the Select Query dropdown menu to select the query you wish to execute.
The Query will open in the box below:
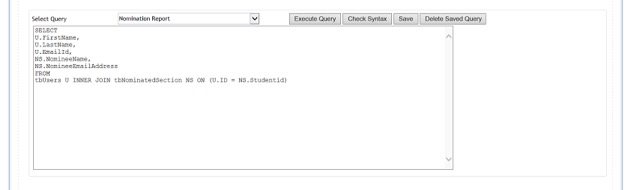
Step 2: Click the Execute Query to run the report
![]()
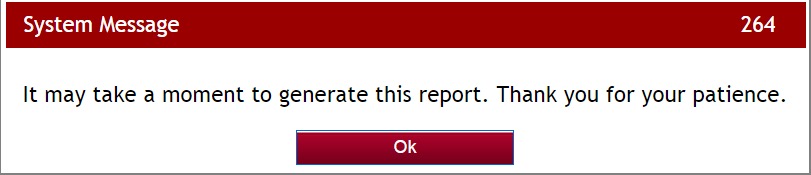
Step 3: A System Message will appear, hit OK to continue
Step 4: The Query Result will show below the query box.
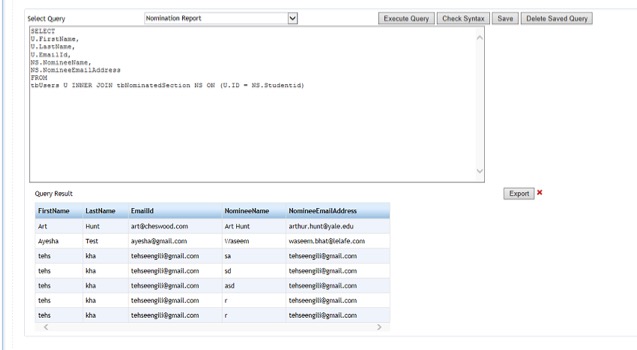
Step 5: You can view the report online or click the Export Button to export the report to Excel and download it to your computer.

Clicking the red “X“ next to the Export will close the report
1.2.3 Checking Syntax on a created Query
While in the Ad Hoc Query, you can check Syntax by clicking on the Check Syntax button.
![]()
This will do a syntax check and show you the results. It will check for any syntax errors in your file and supply you will an error message: i.e.: Error in executing query…!!! Incorrect syntax near ‘FROM’.
If no errors you will get a message: Query Executed Successfully with # of Records.
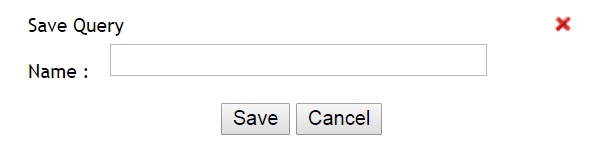
If you have written a query, select the Save button to name your report and save the query.
The following screen will appear, enter the name and click Save.
![]()
Delete Saved Query will remove the Query from the system completely.
![]()
1.3 Section Status Report
The section status report is used to view all the applicants and what percentage of completion they have completed each section in the application. This report will show you a listing of all the applicants and each section in their dashboard. Each column will show the section and the percentage completed by that applicant.
1.3.1 Accessing the Section Status Report
Step 1: From the Home page select Evaluations

Step 2: This will direct you to the Evaluations screen. Custom Reports are created for each individual application, therefore, you will need to click on the appropriate application that you want to create the custom report for.
Step 3: Once you select the application you will be directed to the Evaluation Dashboard, select the Reports icon.

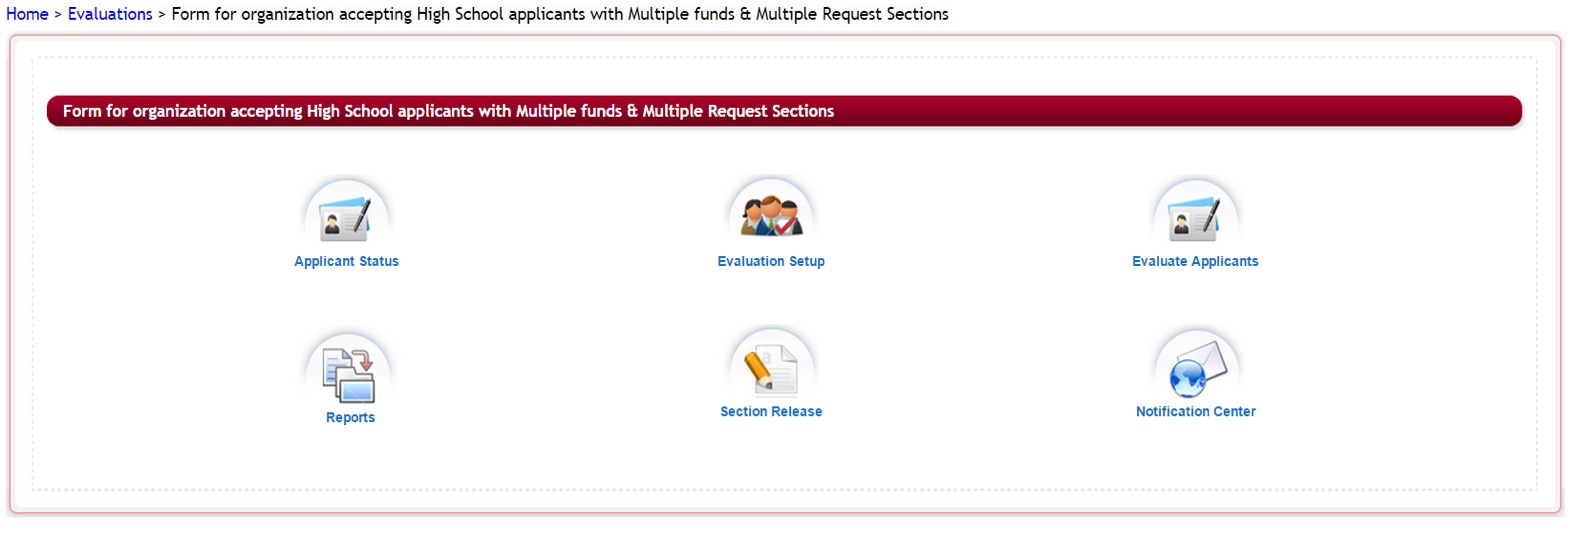
Step 4: This will direct you to the Reports dashboard. Select the Section Status Report icon.
Step 5: This report will take a while to run due to all the data it is compiling. Once it has completed the following report will appear.
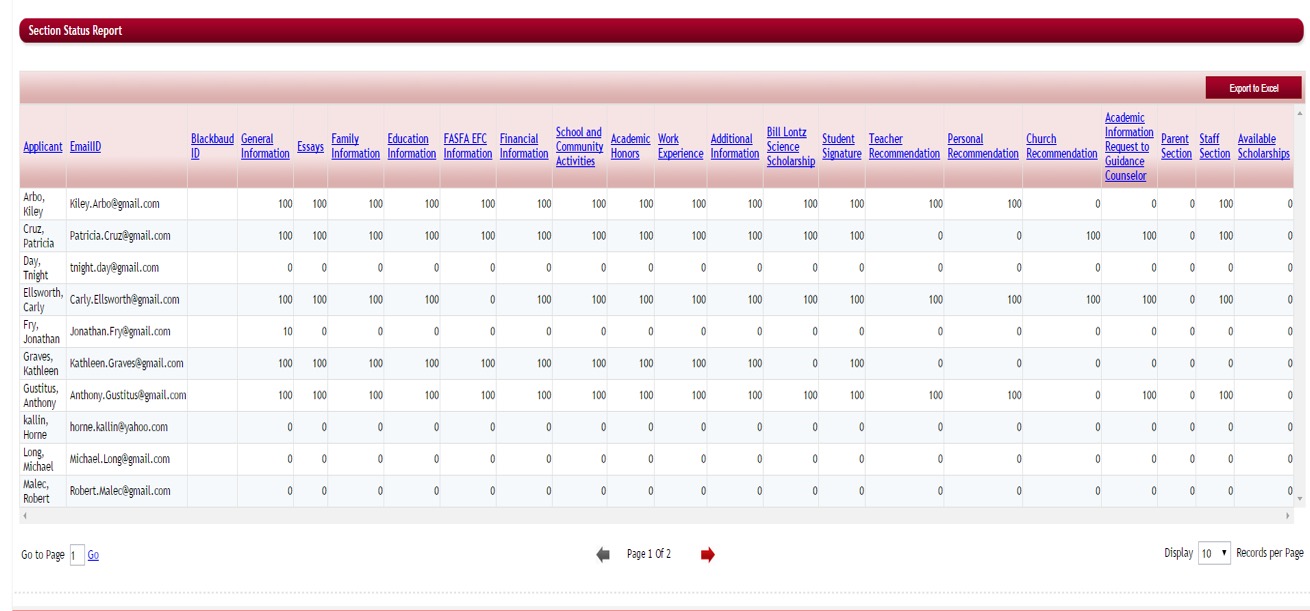
Step 6: To better view the report you can click on the Export to Excel to download an Excel version on to your local computer.
1.4 Introduction to Institutional Reports
Institutional Reports allows you to create Ad Hoc reports in the system by pulling data from multiple application forms, by Academic Years, Sponsoring Organizations, and Applications.
It does not limit you to one specific year, sponsoring organization, or application but gives you the ability to get a full picture of your program over the course of time. There is no limit on the number of reports that you can create.
1.4.1 Accessing the Institutional Reports
Step 1: From the Home dashboard, click on the Institutional Report icon.
The following screen will open:
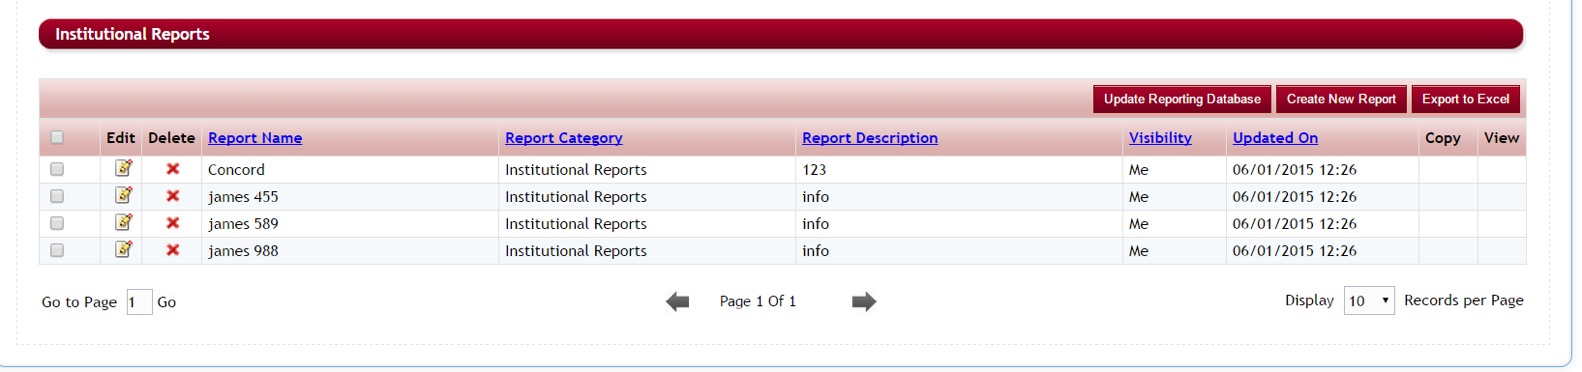
Institutional Reports Listing Overview:
![]() - Allows you to export a listing of all the institutional reports that are in the Report List to an Excel spreadsheet.
- Allows you to export a listing of all the institutional reports that are in the Report List to an Excel spreadsheet.
- Report Name - Name the report has been given when created. Clicking on this column header will sort the Report Name listing alphabetically.
- Report Description - Brief description of the report’s purpose. Clicking on this column header will sort the Report Description listing alphabetically.
- Visibility – ALL or ME – This will let you know who can see the report. Whether it is Visible to Me, for reports that only you want to be able to view or Visible to All, to allow all the Admin to be able to view.
- Updated On – Shows the date and time, the report was last updated with current data. This date will change when the report has been edited and when the Update Reporting Database button has been pushed.
![]() - Edits an existing report
- Edits an existing report
X – Deletes and existing Report
1.4.2 Creating an Institutional Report:
To create Institutional Reports follow the same steps as creating Ad Hoc Reports. The only difference in setting up an AdHoc Reports and Institutional Reports is the options in the beginning of creating your report. Institutional Reports will allow you to choose the Academic Years, Sponsoring Organizations and Applications across the system to pull data into a report.
Using a Master Application Concept is key to creating effective reports in this feature so that all the xml names match in all your applications, and the same items can be pulled into the institutional report per those matched xml names.
Step 1: While in the Institutional Report listing, click on the Create New Report button
![]()
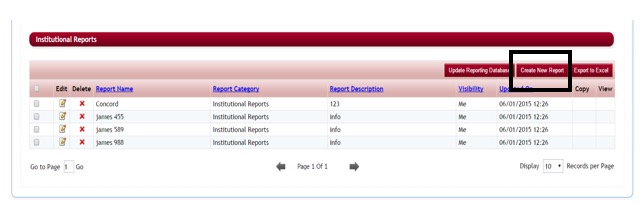
Step 2: The following screen will appear:
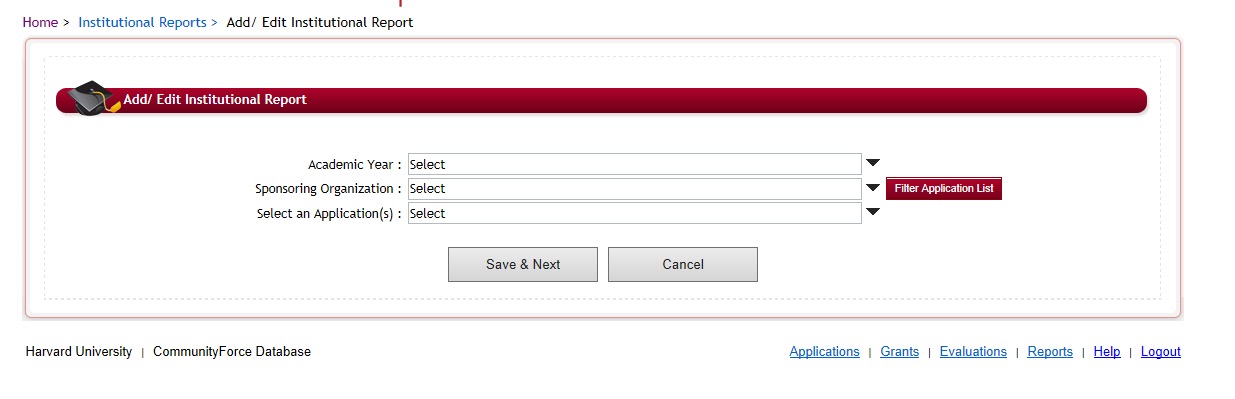
Step 3: You will need to filter for the Applications that you are wanting the institutional reporting on.
Select the dropdown arrows next to each field and select all the appropriate items/applications you want to filter on. If you want all the applications to appear filter only on the Select an Application.
Academic year – allows you to filter applications and include only for a specific academic year.
Sponsoring Organization – allows you to filter and include applications only for a specific sponsoring organization.
Click the Filter Application List button to filter and update the application listing.
![]()
Select and Application: Displays all available applications per the selections made above. Select all the applications you want to include in the report.
Step 4: Once you have selected all the applications you want for the report. Click Save and Next to continue. The remaining will be just like creating an Ad Hoc report. (See Creating Ad Hoc reports for more in depth instructions)
1.4.3 Viewing Institutional Reports
After you have created your report and have returned to the Institutional report listing you will need to update your report with the most current data. Once the data has updated you can view the report.
Step 1: While in the Institutional Report listing, click on the Update Reporting Database button. Failure to click this will only retrieve data that has been entered since the last Update On date and will result in missing data.
![]()
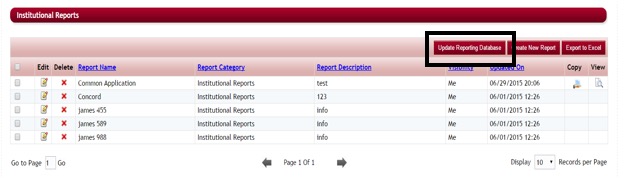
Step 2: Depending on how much data you have this may take some time to run. You will receive a message once it is completed. Click OK to continue.
Step 3: To view your report, click on the viewicon to the far right of the report. The report will open as follows:
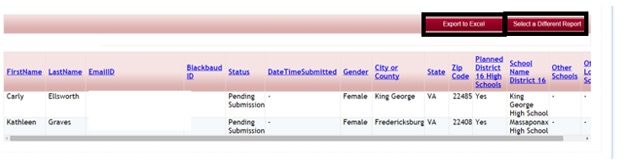
Step 4: You can use the scroll bar at the bottom and sides to move across the page and up and down to view additional applicants and columns. However, it is easier to export the report to Excel and view it in Excel. From there you can filter or edit the report in any manner that is needed. To export click the Export to Excel button located at the top of the report.
![]()
Step 5: This will then open the report as an Excel document on your local computer. Be sure to save the document so that you do not lose any additional formatting that you have done to it after you have exported it.
Step 6: When you are done viewing the report click the Select a Different Report to return to the Institutional Report listing.